Prevalence and Patterns of Alcohol Use
Key Points
- Australia lies in the highest 10% of countries for alcohol use and harms. Overall consumption has fallen, along with changes in the types of alcohol beverages consumed.
- Alcohol consumption is higher amongst men (though gender differences are diminishing), younger people, and in regional areas.
- Consumption also remains higher among sexuality and gender diverse individuals, and some culturally and linguistically diverse individuals.
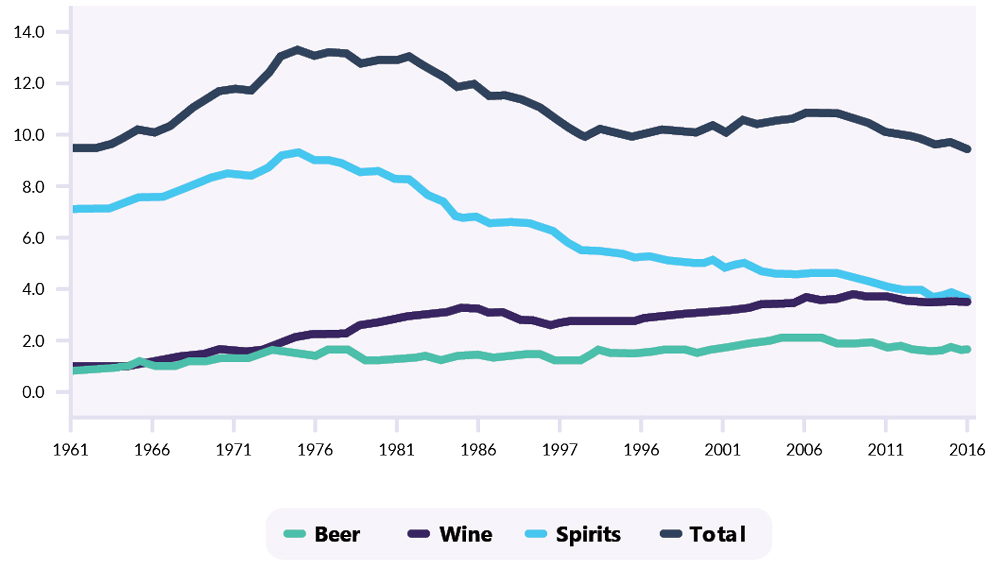
Per capita alcohol consumption in Australia reached the lowest point in 50 years, at 9.4 litres of pure alcohol consumed in 2017 (Figure 2.1). Nonetheless, Australia is still above the OECD average (8.9 litres), ranking 16th for per-capita alcohol consumption. In the past 50 years, there has also been a change in the type of alcohol consumed; Beer consumption has dropped from 75% of overall alcohol consumed to 39%, while wine has increased from 12% to 38% (Figure 2.1).

Figure 2.1: Per capita alcohol consumption (aged 15+) by beverage type from 1961-2017.
The Prevention Paradox of Alcohol Use & Harms
Despite reductions in consumption, Australia is still seeing a rise in harms due to alcohol. It has been argued this paradox can be attributed to the majority of alcohol (58%) being consumed by a small proportion of high risk people who drink, while social or low risk people who drink are reducing consumption. However, reductions in consumption by low risk people who drink does not impact significantly on the risk of harms.
This suggests that public health messaging is more effective for low risk people who drink who consequently drink less, but with minimal change in harms. Conversely, high risk people who drink appear less responsive and high rates of harm continue, reflecting the ‘prevention paradox’ as seen in other countries, and other areas of public health.
The most comprehensive estimate of patterns and prevalence of drinking in Australia is from the National Drug Strategy Household Survey, with 2016 results indicating that 77% of Australians aged 14 and over reported drinking alcohol in the 12 months prior. There was also an overall downward trend in drinking, with the proportion of those reporting no past year consumption steadily increasing since 2001 (18% vs. 23%). There were also significant declines in the number of daily people who drink (6.5% to 5.9%), weekly people who drink (37.3% to 35.8%), along with a significant increase in those who drink less than weekly (34.5% to 35.8%).